
Predicting Radio Tower Structural Health from Cable Vibration Spectral Monitoring
Cable-stayed radio towers use tensioned cables as integral components of their structure. Traditional tension measurement requires expensive equipment, tower access, and manual interaction to physically pull the cables. Wind forces can make measurement challenging. For a 1000-foot tower with many cables, the expense of inspection results in long unmonitored periods without visibility of structural health. We sought a non-invasive way to monitor structural health continuously and turn wind forces from a challenge to an advantage.
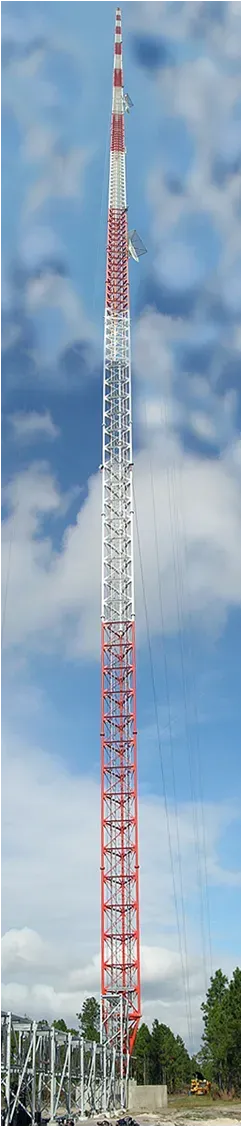
Cable-stayed radio tower with tensioned support cables.
Vibration-based tension measurement works well for bridge cables and other simple systems where tension relates to frequency through f ∝ sqrt(T/μ). But tower guy cables are different. They sag significantly under their own weight. They have heavy non-conducting insulator elements distributed along their length. These point masses and the cable geometry create complex vibration modes that simple formulas can't predict.
Our sponsor, Dr. Jonathan Russell from the Coast Guard Academy, developed a finite element analysis method that accounts for these complexities. His algorithm models the cable in discrete elements, builds a global stiffness matrix, and uses the Newton-Raphson method to predict natural frequencies for cables with point masses, sag, and inclined spans. We built the measurement system to extract those frequencies from accelerometer data: capturing vibration signals, analyzing frequency spectra, and identifying natural modes.
We found that the opportunity was broader than single-point tension measurement. Wind forces continuously excite the tower structure, sweeping the cables through different tension states. The paths traced by natural frequencies across these tension sweeps create spectral fingerprints for the tower-cable system. Deviations from established fingerprints could indicate component failure — a broken insulator, loosened anchor, cable fatigue, or other structural damage. Machine learning could enable anomaly detection, comparing observed spectral pattern sweeps against expected behavior to flag degradation before catastrophic failure.
Implementation
We used an ADXL322 accelerometer (±2g sensitivity), a Picoscope 2203 oscilloscope for data acquisition, and a Texas Instruments eZdsp F28335 DSP board for real-time processing. In the dead of night, we took measurements on actual radio towers and created a scale model in our lab. The lab setup included a force transducer to measure actual tension for validation.
The signal processing was an interesting challenge. Raw accelerometer data is noisy, and identifying the cable's natural frequency from the frequency spectrum requires careful peak detection. We implemented a spike fitting algorithm that treated each peak as an equilateral triangle and calculated the peak center using the relative heights of points around it. This gave sub-bin frequency resolution from the FFT.
Noise reduction used a median-based approach with a multiplier between 2 and 4. If a sample deviated from the median by more than that threshold, we replaced it with the median. This preserved the actual signal while removing outliers.
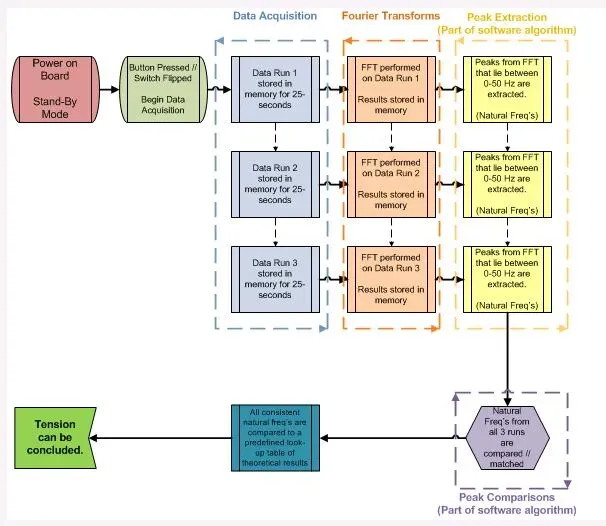
Real-time DSP processing pipeline: data acquisition, FFT, peak extraction, and tension calculation
We implemented the algorithm twice: first in MATLAB to verify the approach, then in embedded C on the DSP board for real-time operation. The two implementations gave matching results within 0.01 Hz.
Results
The system worked. For cable tensions between 31 and 34 lbf, we identified frequencies within 0.05 Hz of the actual values. The predicted tensions matched the force transducer readings within 0.03 Hz, which translates to acceptable tension accuracy for structural monitoring.
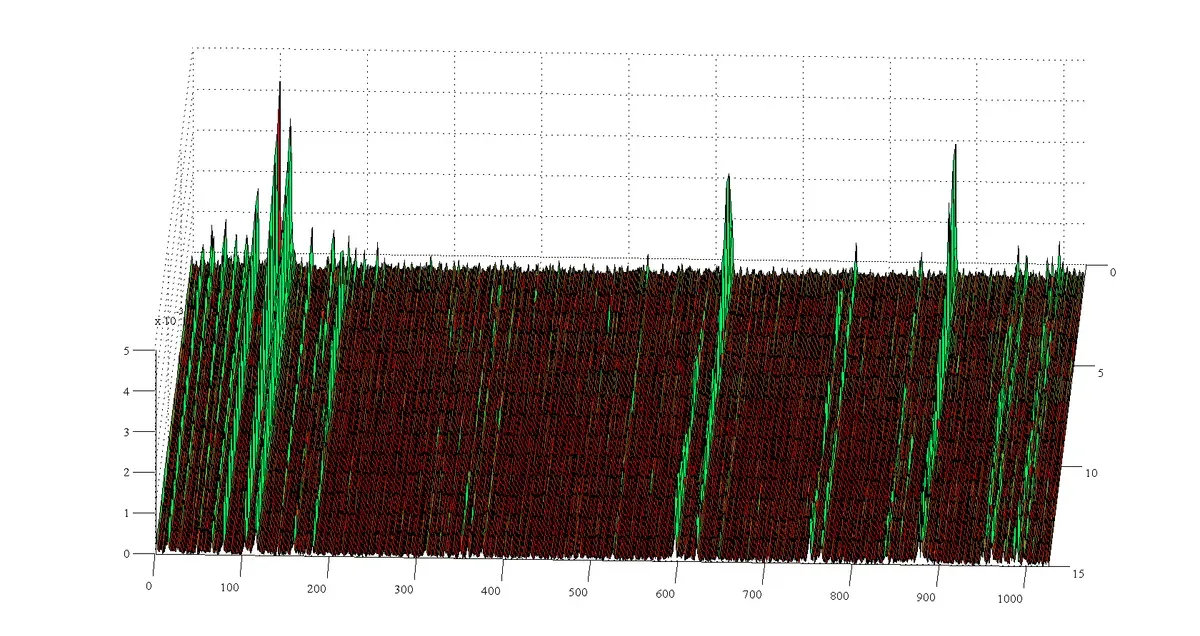
Frequency spectrum showing clear resonance peaks (green) emerging from noise floor (red) as cable tension increases
The interesting part was seeing how sensitive the measurements were to setup. The accelerometer mounting location mattered. Cable boundary conditions (how it's anchored) affected the frequency-tension relationship. Environmental factors like temperature and humidity changed the cable properties slightly.
We also found that the median noise filter worked better than expected. It removed transient spikes without smoothing out the actual vibration signal. The spike fitting algorithm gave us better frequency resolution than just taking the FFT bin with the maximum value.
What Didn't Work Initially
The first FFT implementation gave us frequencies, but they were quantized to the bin width. For a cable with a natural frequency at 12.37 Hz, we'd get either 12.0 Hz or 12.5 Hz depending on the FFT parameters. That's not enough resolution to distinguish between different tension states.
The spike fitting algorithm solved this by interpolating between bins, but it required clean peaks. If the noise floor was too high, the algorithm would fit to noise instead of signal. That's why we needed the median filter first.
Getting the DSP code to match the MATLAB implementation also took iteration. Floating-point precision differences between the platforms meant we had to verify every calculation. The final embedded C implementation ran the full FFT and spike detection in real time at 50 MHz clock speed.
Technical Details
Hardware: ADXL322 accelerometer (±2g), Picoscope 2203 (8-bit), TI eZdsp F28335 DSP board (50 MHz), Omega LC201-50 force transducer. Lab setup used a 45-foot steel cable with adjustable tension and added masses to change system properties.
Algorithm: Fast Fourier Transform for frequency analysis, spike fitting using equilateral triangle intersection method (peak offset x = (1/2) × (y3 - y1)/(y2 - y1)), median-based noise reduction with multiplier 2-4.
Implementation: MATLAB prototype for verification, embedded C on DSP for real-time operation. Both implementations gave matching results within 0.01 Hz.
Results: Frequency identification within 0.05 Hz, tension predictions within 0.03 Hz for cable tensions 31-34 lbf.
This was my senior design project at UConn, in partnership with students from mechanical and electrical engineering. The work combined computer engineering (DSP implementation), civil engineering (structural dynamics), and signal processing (frequency analysis). The 56-page report includes the mathematical derivations, algorithm descriptions, experimental setup, and validation results.
Resources
Full Technical Report (PDF)
- Includes theoretical foundation, frequency-tension relationship derivations, spike fitting algorithm details, experimental setup, validation results, and error analysis.